

The Gap in Standard Testing
You step on the scale, watch your diet, exercise regularly, and still wonder whether your efforts are truly reversing insulin resistance. Standard fasting glucose alone often looks normal for years while underlying metabolic dysfunction progresses silently. Research from the University of Texas Health Science Center at San Antonio shows that severe insulin resistance can appear 10 to 15 years before glucose crosses the prediabetes threshold, meaning conventional screening catches the problem far too late.
This article delivers a comprehensive lab panel that proves whether your insulin resistance is reversing or advancing. You will learn which five markers to order, the optimal reference ranges backed by 2024 to 2026 peer-reviewed research, and the timeline for seeing measurable improvements. Each section includes actionable steps, interpretation guidance, and realistic expectations so you can track progress with the same rigor clinicians use in metabolic research.
By the end, you will know exactly which tests to request at your next appointment, how to calculate key indices such as HOMA-IR and the triglyceride-to-HDL ratio, and what changes signal true metabolic healing. You will also understand why fasting insulin, not just fasting glucose, is the earliest warning sign and how to integrate continuous glucose monitoring for real-time feedback. This is the roadmap that transforms vague hope into quantifiable progress.
Step 1: Order Fasting Insulin And Glucose
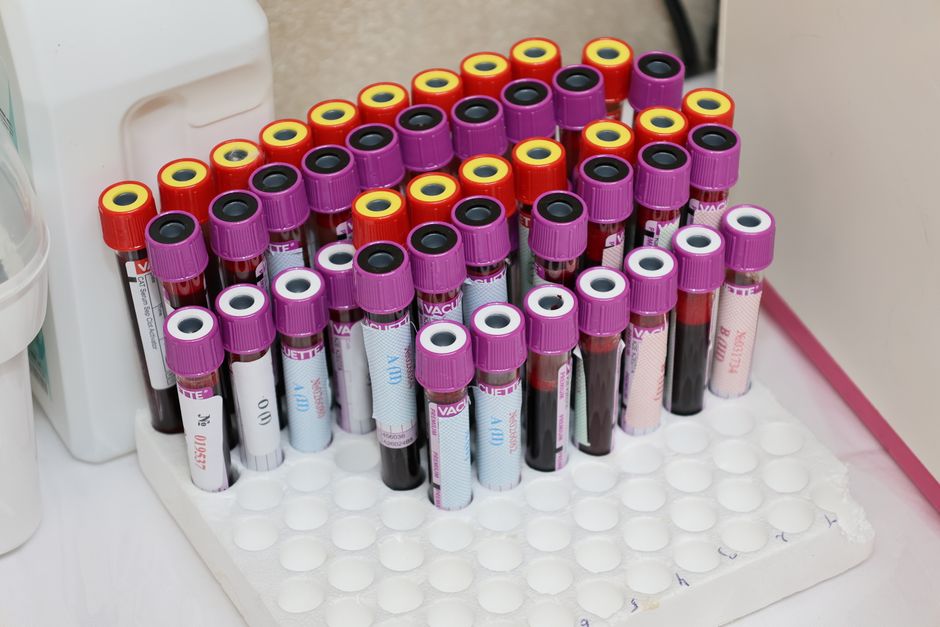
WHY THIS MATTERS
Fasting glucose alone can remain below 100 milligrams per deciliter (mg/dL) for years while your pancreas secretly pumps out two or three times the normal amount of insulin to maintain that reading. You feel no symptoms, yet your beta cells (the insulin-producing cells of the pancreas) are under siege and your tissues are growing resistant. Measuring fasting insulin alongside glucose unmasks this hidden overwork. A 2024 study published in BMC Endocrine Disorders established age- and gender-adjusted reference intervals for fasting insulin and confirmed that levels persistently above 10 µU/mL correlate with a significantly elevated HOMA-IR score, even when fasting glucose remains under 100 mg/dL (Schrank et al., 2024). The authors concluded that measuring fasting insulin provides an early, actionable signal of metabolic dysfunction up to a decade before overt hyperglycemia (persistently elevated blood glucose) emerges. A 2024 analysis in Frontiers in Endocrinology proposed reference intervals of 2.52 to 13.14 µU/mL for fasting insulin in healthy adults, but metabolic optimization experts recommend aiming for the lower end of that range, ideally 2 to 6 µU/mL, to maximize insulin sensitivity and minimize long-term risk.
What You Need to Know
What is fasting insulin? Fasting insulin measures how much insulin is in your blood after you have not eaten for 8 to 12 hours. Insulin is the hormone that helps sugar move from your blood into your cells for energy or storage.
Why does it matter? When your cells become resistant to insulin, your pancreas makes more of it to try to keep blood sugar normal. High fasting insulin is the first sign of trouble, often appearing 5 to 10 years before your blood sugar rises. Standard diabetes panels do not include fasting insulin unless you ask for it specifically.
What are the ranges?
| Fasting Insulin Level | What It Means | Action Needed |
|---|---|---|
| 2–6 µU/mL | Optimal: your pancreas is working efficiently | Maintain current lifestyle |
| 7–10 µU/mL | Early warning: your pancreas is working harder than it should | Start dietary changes, increase exercise |
| Above 10 µU/mL | Significant insulin resistance: your pancreas is overworking | Implement all 5 steps in this series immediately |
What is fasting glucose? This measures the sugar in your blood after fasting. It is the standard test doctors order, but it misses early insulin resistance because glucose can remain normal for years while insulin silently rises.
What are the ranges?
| Fasting Glucose | What It Means |
|---|---|
| 70–85 mg/dL | Optimal |
| 86–99 mg/dL | Acceptable (but watch insulin levels) |
| 100–125 mg/dL | Pre‑diabetes (per ADA 2025) |
| 126+ mg/dL | Diabetes (per ADA 2025) |
Note that while the conventional prediabetes threshold for fasting glucose is 100 mg/dL, optimal metabolic health targets fasting glucose between 70 and 85 mg/dL. Your initial goal is to trend downward; the full target ranges are presented in this article.
1. Schedule the blood test
Call your doctor's office or use an online lab service (Quest Diagnostics, LabCorp, Ulta Lab Tests, or Walk-In Lab). Say: "I need a fasting insulin test and a fasting glucose test."
Cost: Usually $20–$50 without insurance and are often covered when your doctor writes the order. Ask specifically for fasting insulin in addition to fasting glucose, because fasting insulin is frequently omitted from standard panels unless requested.
2. Prepare for the test
- Fast for 8 to 12 hours before your appointment (water only)
- Don't drink alcohol for 24 hours before
- Don't do intense exercise the evening before
- Schedule your appointment for early morning, ideally between 7 and 9 am, so that fasting is completed during overnight sleep rather than requiring extended daytime restriction. Some people feel lightheaded or hungry during the fasting period; this is normal and resolves immediately after eating.
3. Get your results
Most labs send results within 24 to 48 hours. Your report will include two numbers:
- Fasting Insulin: reported in µU/mL (microunits per milliliter)
- Fasting Glucose: reported in mg/dL (milligrams per deciliter)
4. Record both numbers in your tracking document from Article 1 using the format below. You will need these numbers for Step 2.
Date: ______________
Fasting Insulin: ______________ µU/mL
Fasting Glucose: ______________ mg/dL
5. Repeat testing every three months during active reversal. Once you reach your target ranges (insulin 2 to 6 µU/mL, glucose 70 to 85 mg/dL), shift to testing every 6 to 12 months to confirm maintenance.
(Note: Some people feel lightheaded or hungry during the fasting period—this is normal and resolves immediately after eating.)
Within three months of implementing a targeted low-glycemic diet, post-meal walking, and twice-weekly resistance training (detailed in Articles 2 and 3), expect fasting insulin to drop by 15 to 30 percent and fasting glucose to decrease by 5 to 10 mg/dL. These changes confirm your intervention is working at the cellular level.
Step 2: Calculate Your HOMA-IR Score

WHY THIS MATTERS
Homeostatic Model Assessment of Insulin Resistance (HOMA-IR) combines fasting insulin and fasting glucose into a single score that reflects how hard your pancreas is working to maintain blood sugar control.
A 2025 analysis of metabolic syndrome cohorts reported cutoff values between 2.0 and 2.6 for defining insulin resistance, with the 85th percentile threshold falling at approximately 2.4, which this series adopts as its standard early-resistance threshold.
The resistance training protocol detailed in Article 3 has been shown in network meta-analysis to rank among the top-performing exercise modalities for HOMA-IR reduction, making it the recommended movement strategy to combine with this measurement system.
What You Need to Know
What is HOMA‑IR? It is a simple calculation that combines your fasting insulin and fasting glucose into one number. Think of it as a stress test for your pancreas: it reveals not just what your blood sugar is, but how hard your body is working to keep it there.
Why does it matter? A single number tells you instantly whether you have insulin resistance and how severe it is. It is easier to track meaningful progress with one combined score than with two separate values interpreted independently.
How do I calculate it?
This series standardizes on the US-unit formula, which uses glucose reported in mg/dL as is standard in the United States. If your glucose result is reported in mmol/L (standard in Canada, the United Kingdom, and Australia), the alternative formula is provided below.
US-unit formula (glucose in mg/dL):
HOMA-IR=Fasting Insulin (µU/mL)×Fasting Glucose (mg/dL)405
SI-unit formula (glucose in mmol/L):
HOMA-IR=Fasting Insulin (mU/L)×Fasting Glucose (mmol/L)22.5
Both formulas produce identical results. Use whichever matches the units on your lab report.
STEP‑BY‑STEP EXAMPLE (US units):
Your test results: Fasting Insulin = 12 µU/mL, Fasting Glucose = 95 mg/dL
Step 1: Multiply insulin × glucose:
12×95=1,140
Step 2: Divide by 405:
1,140÷405=2.81
Your HOMA-IR score: 2.81 (this indicates early insulin resistance)
Easier method: Use the free online calculator at https://www.mdcalc.com/calc/3120/homa-ir. Enter your fasting insulin and fasting glucose values and the result is calculated instantly, in approximately 10 seconds, with no registration required.
What do the scores mean?
| HOMA‑IR Score | What It Means | Action Needed |
|---|---|---|
| Below 1.0 | Excellent insulin sensitivity | Maintain current lifestyle |
| 1.0–2.4 | Normal range | Monitor yearly; optimize if approaching 2.0 |
| 2.4–3.8 | Early insulin resistance | Start all 5 steps in this series |
| Above 3.8 | Significant insulin resistance | Urgent: implement diet, exercise, stress and sleep changes |
Note that published cutoff values vary across studies and populations. Use these thresholds as directional guidance and discuss your specific result with your physician.
1. Get your fasting insulin and glucose results from Step 1
Write them here:
- Fasting Insulin: ______________ µU/mL
- Fasting Glucose: ______________ mg/dL
2. Calculate your HOMA‑IR score using one of the following methods.
Option A (manual calculation, US units):
- Insulin × Glucose = ______________
- That number ÷ 405 = ______________ ←Your HOMA-IR
Option B (use the free calculator):
- Go to https://www.mdcalc.com/calc/3120/homa-ir
- Enter your numbers
- Get instant result
3. Write down your score and the date
Date: ______________
HOMA-IR Score: ______________
Goal: Reduce by at least 0.5–1.0 point in 3 months
4. Set a reduction goal based on your starting score.
If your score is 3.8, aim for 2.8 or lower within 3 to 6 months.
If your score is 2.5, aim for below 2.0 within 3 months.
Once you reach a score below 2.0, you have objectively reversed insulin resistance by the standard thresholds used in this series and can shift to maintenance monitoring every 6 to 12 months.
5. Retest every 3 months and recalculate
Track your progress using a simple table:
| Date | Fasting Insulin | Fasting Glucose | HOMA‑IR | Change |
|---|---|---|---|---|
| Baseline | \_\_\_\_\_\_\_\_ | \_\_\_\_\_\_\_\_ | \_\_\_\_\_\_\_\_ | −\_\_\_\_\_\_\_\_ |
| 3 months | \_\_\_\_\_\_\_\_ | \_\_\_\_\_\_\_\_ | \_\_\_\_\_\_\_\_ | −\_\_\_\_\_\_\_\_ |
| 6 months | \_\_\_\_\_\_\_\_ | \_\_\_\_\_\_\_\_ | \_\_\_\_\_\_\_\_ | −\_\_\_\_\_\_\_\_ |
Retest every 3 months during active reversal and recalculate your score each time.
A drop in HOMA-IR from 3.8 to 2.8 within three to six months signals meaningful metabolic improvement. Consistent adherence to the dietary strategy in Article 2, the resistance training protocol in Article 3, and the sleep and stress management practices in Article 5 typically produces HOMA-IR reductions of 0.5 to 1.5 points over three to six months.
Step 3: Check Your Triglyceride-To-HDL Cholesterol Ratio

WHY THIS MATTERS
Your triglyceride-to-HDL cholesterol (TG/HDL) ratio serves as a simple, inexpensive proxy for insulin resistance and small LDL particle burden (a pattern of small, dense LDL cholesterol particles that carry greater cardiovascular risk than standard LDL measurements reveal). Elevated triglycerides and low HDL cholesterol often appear years before fasting glucose rises, making this ratio an early warning signal.
The ratio also correlates with visceral adiposity (excess fat stored around the internal organs), hepatic steatosis (fat accumulation in the liver), and cardiovascular risk, giving you a window into multiple metabolic pathways with one calculation.
What You Need to Know
What is the TG/HDL ratio? It is a simple division: your triglycerides divided by your HDL cholesterol. Both numbers come from a standard cholesterol test called a lipid panel.
Why does it matter? This ratio predicts insulin resistance better than cholesterol measurements alone and often rises 5 to 10 years before blood sugar does, giving you an early warning that diet and exercise changes can act on immediately.
What is a lipid panel?
A common blood test that measures:
- Total Cholesterol
- LDL Cholesterol ("bad" cholesterol)
- HDL Cholesterol ("good" cholesterol)
- Triglycerides (a type of fat in the blood that rises with excess carbohydrate and sugar intake).
You only need the last two numbers (HDL and Triglycerides) for this ratio.
How do I calculate it?
TG/HDL Ratio=Triglycerides (mg/dL) HDL Cholesterol (mg/dL)
STEP‑BY‑STEP EXAMPLE:
Let's say your lipid panel shows:
- Triglycerides: 150 mg/dL
- HDL Cholesterol: 50 mg/dL
Calculation:
150÷50=3.0
Your TG/HDL ratio: 3.0
What do the scores mean?
| Your Sex | TG/HDL Ratio | What It Means | Action Needed |
|---|---|---|---|
| Women | Below 2.0 | Optimal | Maintain current lifestyle |
| Women | 2.0–3.5 | Early insulin resistance | Start dietary changes |
| Women | Above 3.5 | Significant metabolic dysfunction | Urgent intervention needed |
| Men | Below 3.0 | Optimal | Maintain current lifestyle |
| Men | 3.0–5.0 | Early insulin resistance | Start dietary changes |
| Men | Above 5.0 | Significant metabolic dysfunction | Urgent intervention needed |
Note for lean or low-BMI individuals following the LCHF framework from Article 2: some people in this group experience LDL cholesterol elevation when increasing dietary fat intake. Lipid monitoring at the four-week and twelve-week marks is recommended to catch this early. Discuss any rising LDL trend with your physician before continuing.
1. Order a lipid panel
Call your doctor and say: "I need a fasting lipid panel."
Or use an online lab service:
- Quest Diagnostics: Search "lipid panel" (cost: $30–$50)
- LabCorp: Search "cholesterol test" (cost: $30–$50)
- Ulta Lab Tests: Order "lipid panel with ratios" (cost: $25–$40)
- Walk-In Lab: Search "cholesterol test" (cost: $30–$45)
Preparation:
- Fast for 9 to 12 hours (water only)
- Schedule for early morning
- Avoid alcohol 24 hours before
2. Get your results
Your report will look something like this:
LIPID PANEL RESULTS
Total Cholesterol: 195 mg/dL
LDL Cholesterol: 115 mg/dL
HDL Cholesterol: 45 mg/dL ← You need this number
Triglycerides: 175 mg/dL ← You need this number
3. Calculate your TG/HDL ratio
Manual calculation:
Write your numbers:
- Triglycerides: ______________ mg/dL
- HDL Cholesterol: ______________ mg/dL
Divide:
Triglycerides÷HDL= ______________ ←Your ratio
Example: 175 ÷ 45 = 3.89
4. Compare to target ranges
If you're a woman and your ratio is 3.89 → You're in the "significant dysfunction" zone
If you're a man and your ratio is 3.89 → You're in the "early resistance" zone
5. Set a goal and retest every 3 to 6 months
Track your progress:
| Date | Triglycerides | HDL | TG/HDL Ratio | Target |
|---|---|---|---|---|
| \_\_\_\_\_\_\_\_ | \_\_\_\_\_\_\_\_ | \_\_\_\_\_\_\_\_ | \_\_\_\_\_\_\_\_ | Women \<2.0 / Men 3.0 |
| \_\_\_\_\_\_\_\_ | \_\_\_\_\_\_\_\_ | \_\_\_\_\_\_\_\_ | \_\_\_\_\_\_\_\_ | |
| \_\_\_\_\_\_\_\_ | \_\_\_\_\_\_\_\_ | \_\_\_\_\_\_\_\_ | \_\_\_\_\_\_\_\_ |
How to improve your ratio:
- Reduce added sugars and refined carbs (Article 2)
- Eat fatty fish 2–3 times per week (salmon, sardines, mackerel)
- Add walnuts, flaxseed, and leafy greens daily
- Walk 10–15 minutes after meals (Article 3)
Expect your TG/HDL ratio to drop by 0.5 to 1.5 points over three months with consistent dietary and exercise changes from Articles 2 and 3. A ratio falling below 2.0 (women) or 3.0 (men) indicates improved insulin sensitivity and reduced cardiovascular risk.
Step 4: Measure Hemoglobin A1C And Calculate Estimated Average Glucose

WHY THIS MATTERS
Hemoglobin A1c (HbA1c) reflects your average blood glucose over the preceding two to three months by measuring the percentage of hemoglobin molecules (the oxygen-carrying proteins in red blood cells) that have glucose attached to them. The American Diabetes Association 2025 Standards of Care define prediabetes as an HbA1c between 5.7 and 6.4 percent, and diabetes as HbA1c at or above 6.5 percent. Optimal metabolic health targets an HbA1c below 5.4 percent, which corresponds to an estimated average glucose (eAG, a conversion of your HbA1c percentage into an average daily blood sugar number in mg/dL that is easier to interpret) under 108 mg/dL. Tracking HbA1c every three to six months provides objective evidence that your interventions are lowering chronic glucose exposure, even if fasting glucose alone shows minimal change at first.
What You Need to Know — Simplified
What is HbA1c? Hemoglobin A1c (also written as "A1C" or "glycated hemoglobin") measures how much sugar has attached to your red blood cells over the past 2 to 3 months. Think of it as your glucose report card: where a fasting glucose test is a snapshot of one moment in time, HbA1c is the full-term average.
What is eAG (estimated Average Glucose)?It is a conversion that turns your HbA1c percentage into an average daily blood sugar number in mg/dL, making the result more intuitive and directly comparable to your glucometer readings.
How do I calculate eAG?
eAG (mg/dL) = (28.7 X HbA1c% ) - 46.7
STEP‑BY‑STEP EXAMPLE:
Let's say your HbA1c result is: 5.8%
Calculation:
28.7×5.8=166.46
166.46−46.7=119.76 mg/dL
Your eAG: 120 mg/dL (rounded)
This means your average blood sugar over the past 3 months was about 120 mg/dL.
EASIER METHOD — Use a free calculator:
- Go to: https://professional.diabetes.org/glucose\_calc (American Diabetes Association official calculator)
- Enter your HbA1c percentage
- Get instant eAG result in mg/dL and mmol/L
What do the ranges mean?
| HbA1c % | eAG (mg/dL) | What It Means | Action Needed |
|---|---|---|---|
| Below 5.4% | Below 108 | Optimal metabolic health | Maintain lifestyle |
| 5.4–5.6% | 108–118 | Low risk | Monitor yearly |
| 5.7–6.4% | 118–137 | Pre‑diabetes (ADA 2025) | Implement all 5 steps |
| 6.5% or higher | 137+ | Diabetes (ADA 2025) | Urgent: see your doctor |
1. Order an HbA1c test
Good news: No fasting is required, so this test can be scheduled at any time of day. You have three options.
How to order:
Option A — Through your doctor: Call your doctor and say "I need an HbA1c test." This is a routine order.
Option B — Online lab services: Use an online lab service. Quest Diagnostics, LabCorp, Ulta Lab Tests, and Walk-In Lab all offer HbA1c tests for approximately $15 to $35.
Option C — Home test kits: Purchase an over-the-counter home test kit such as the CVS A1CNow SelfCheck or Walgreens A1CNow (approximately $30 to $40, results in 5 minutes).
Note that home tests are convenient but slightly less accurate than laboratory tests. Use laboratory tests for official progress tracking and home tests only for interim monitoring between lab draws.
2. Get your result
Your report will show one number:
Hemoglobin A1c: ______________%
3. Calculate your eAG (estimated average glucose)
Manual calculation:
Write your HbA1c: ______________%
28.7×your HbA1c= ______________
That number−46.7= ______________ mg/dL←Your eAG
Example: If HbA1c is 5.8%
28.7×5.8=166.46
166.46−46.7=119.76 mg/dL (round to 120)
Calculate your eAG using the formula above or the online calculator.
- Go to https://professional.diabetes.org/glucose\_calc
- Enter 5.8
- Get result: 120 mg/dL
4. Track your results over time
Create a simple chart:
| Date | HbA1c % | eAG (mg/dL) | Status | Goal |
|---|---|---|---|---|
| \_\_\_\_\_\_\_\_ | \_\_\_\_\_\_\_\_ | \_\_\_\_\_\_\_\_ | \_\_\_\_\_\_\_\_ | Below 5.4% / \<108 mg/dL |
| \_\_\_\_\_\_\_\_ | \_\_\_\_\_\_\_\_ | \_\_\_\_\_\_\_\_ | \_\_\_\_\_\_\_\_ | |
| \_\_\_\_\_\_\_\_ | \_\_\_\_\_\_\_\_ | \_\_\_\_\_\_\_\_ | \_\_\_\_\_\_\_\_ |
5. Set a reduction goal
If your HbA1c is 6.2%:
- Current eAG: 131 mg/dL
- Goal: Drop to 5.7% (eAG 117 mg/dL) in 3 months
- Ultimate goal: Below 5.4% (eAG 108 mg/dL) in 6 months, subject to individual variation.
How to improve:
- Follow the low-glycemic diet in Article 2
- Walk 10–15 minutes after every meal (Article 3)
- Sleep 7–9 hours nightly (Article 5)
- Manage stress daily (Article 5)
6. Retest every 3 to 6 months
during active reversal and every 6 to 12 months once you reach your target. Improving HbA1c requires consistent adherence to all five intervention categories: the dietary strategy in Article 2, the movement protocol in Article 3, and the sleep, stress, and meal timing practices in Article 5 each contribute to the combined result.
Consistent adherence to a low-glycemic diet, daily post-meal movement, and twice-weekly resistance training typically lowers HbA1c by 0.3 to 0.6 percentage points within three months. Stress management alone contributes an additional 0.2 to 0.4 percentage points per three months (covered in Article 5); combined with the dietary and exercise strategies, total HbA1c reduction typically reaches 0.3 to 0.6 percentage points per three-month period. Crossing from the prediabetes range (at or above 5.7 percent) into the optimal range (below 5.4 percent) confirms you have reversed glucose dysregulation by the benchmark used in this series.
Step 5: Add Liver Enzymes, Uric Acid, And C-Peptide For Comprehensive Insight

WHY THIS MATTERS
Insulin resistance rarely exists in isolation. It drives a cascade of metabolic changes including hepatic fat accumulation (fat buildup in the liver, now termed metabolic dysfunction-associated steatotic liver disease, or MASLD, formerly known as NAFLD or non-alcoholic fatty liver disease), elevated uric acid, and progressive beta-cell dysfunction. Alanine aminotransferase (ALT), the most liver-specific enzyme, rises when excess insulin promotes fat synthesis and storage in hepatocytes (liver cells). Elevated serum uric acid reflects impaired kidney and liver clearance of urate under insulin-resistant conditions and independently predicts future diabetes risk. C-peptide (a protein fragment released in equal amounts to insulin when the pancreas produces insulin, making it a stable and direct measure of pancreatic insulin output) provides a direct window into beta-cell reserve: high C-peptide signals the pancreas is oversecreting insulin; low C-peptide signals it may be beginning to fail. Together, these markers complete the metabolic picture beyond glucose and lipids alone.
A 2026 analysis found that serum uric acid above 7.0 mg/dL in men and above 6.0 mg/dL in women is independently associated with a 40 to 60 percent increased risk of incident Type 2 diabetes over five years, even after adjusting for body mass index and waist circumference (Ali et al., 2026).
What You Need to Know
This step adds three more tests to complete your metabolic picture. Don't worry—they're all simple blood draws, usually done at the same time as your other tests.
TEST 1: LIVER ENZYMES (ALT, AST, GGT)
These are proteins that leak into your blood when your liver is stressed. Insulin resistance causes fat buildup in the liver (fatty liver disease), which raises these enzymes. Approximately 30 percent of people with insulin resistance have fatty liver disease even if they do not drink alcohol. These enzymes are your early warning system. Note that elevated liver enzymes can also result from alcohol use, hepatitis, or certain medications; discuss any abnormal result with your physician to rule out other causes before attributing it to insulin resistance alone.
Which enzymes to test:
- ALT (Alanine Aminotransferase) — most specific for liver health
- AST (Aspartate Aminotransferase) — less specific but useful
- GGT (Gamma-Glutamyl Transferase) — sensitive to alcohol and inflammation
What are the ranges?
| Test | Optimal Range | Borderline | High |
|---|---|---|---|
| ALT | Women \<30 U/L, Men \<40 U/L | 30–50 | Above 50 |
| AST | Below 40 U/L | 40–60 | Above 60 |
| GGT | Below 50 U/L | 50–100 | Above 100 |
| AST/ALT Ratio | Below 1.0 (healthy liver) | 1.0–2.0 | Above 2.0 (may indicate alcohol-related damage; discuss with physician) |
How to order:
Ask for a "Comprehensive Metabolic Panel (CMP)" or "Hepatic Function Panel." These include all three liver enzymes. Cost: approximately $25 to $50, often covered by insurance.
TEST 2: SERUM URIC ACID
Uric acid is a waste product from breaking down purines (compounds found in certain foods and in normal cell turnover). When insulin resistance develops, your kidneys clear uric acid less efficiently, allowing it to accumulate. High uric acid predicts diabetes risk 5 to 10 years before blood sugar rises and is also the primary driver of gout (painful joint inflammation caused by uric acid crystal deposits).
What are the ranges?
| Your Sex | Optimal | Borderline | High |
|---|---|---|---|
| Women | Below 6.0 mg/dL | 6.0–7.0 | Above 7.0 |
| Men | Below 7.0 mg/dL | 7.0–8.0 | Above 8.0 |
How to order:
Ask for a "serum uric acid test." Cost: approximately $15 to $30.
How to lower uric acid:
- Reduce alcohol (especially beer)
- Limit high-purine foods (red meat, organ meats, shellfish)
- Drink 8–10 glasses of water daily
- Lose weight gradually (not too fast—rapid weight loss raises uric acid)
TEST 3: C‑PEPTIDE
What is C‑peptide?
When your pancreas makes insulin, it simultaneously produces C-peptide in equal amounts. Measuring fasting C-peptide reveals how much insulin your pancreas is currently producing, without the interference that can affect direct insulin measurements.
Why does it matter?
- High C‑peptide (>3.0 ng/mL): Your pancreas is overworking to overcome insulin resistance
- Low C‑peptide (\<1.0 ng/mL): Your pancreas is failing (beta-cell exhaustion)—urgent medical attention needed
What are the ranges?
| Fasting C‑Peptide | What It Means | Action |
|---|---|---|
| 1.0–2.0 ng/mL | Normal | Maintain lifestyle |
| 2.0–3.0 ng/mL | Mild hyperinsulinemia | Start intervention |
| Above 3.0 ng/mL | Significant hyperinsulinemia | Implement all 5 steps immediately |
| Below 1.0 ng/mL | Beta-cell failure | See your doctor immediately |
How to order:
Ask for a "fasting C-peptide" test. This must be drawn after an 8- to 12-hour fast, at the same time as your fasting insulin and glucose draw. Cost: approximately $40 to $80. This test is not always covered by insurance but is particularly valuable for anyone with HbA1c above 5.7 percent, a family history of diabetes, or who wants to track beta-cell reserve over time.
Who needs this test?
- Anyone with HbA1c above 5.7%
- Family history of diabetes
- Want to track beta-cell health over time
1. Order all three tests together
Call your doctor or lab and say:
"I need a Comprehensive Metabolic Panel with liver enzymes, a serum uric acid test, and a fasting C‑peptide test."
Or order online:
- Quest Diagnostics: Search "CMP" + "uric acid" + "C‑peptide"
- LabCorp: Same search terms
- Total cost: $80–$150 without insurance
Preparation:
- Fast 8–12 hours (C‑peptide requires fasting) the other tests in this step do not, but combining them with fasting insulin and glucose is more efficient.
- Water only
- Schedule early morning
2. Get your results
Your report will show:
LIVER PANEL:
ALT: ______________ U/L
AST: ______________ U/L
GGT: ______________ U/L
SERUM URIC ACID: ______________ mg/dL
FASTING C-PEPTIDE: ______________ ng/mL
3. Compare to target ranges
Create a simple chart:
| Test | Your Result | Optimal Range | Status |
|---|---|---|---|
| ALT | \_\_\_\_\_\_\_\_ | Women \<30, Men \<40 | ✓ or ✗ |
| AST | \_\_\_\_\_\_\_\_ | \<40 U/L | ✓ or ✗ |
| GGT | \_\_\_\_\_\_\_\_ | \<50 U/L | ✓ or ✗ |
| Uric Acid | \_\_\_\_\_\_\_\_ | Women \<6.0, Men \<7.0 | ✓ or ✗ |
| C‑Peptide | \_\_\_\_\_\_\_\_ | 1.0–2.0 ng/mL | ✓ or ✗ |
4. Interpret your results
If ALT is high (women >30, men >40):
- You likely have fatty liver disease
- Focus on: low-glycemic diet, reduce alcohol, lose 5–10% body weight
If uric acid is high:
- You have increased diabetes risk
- Focus on: hydration, reduce purines, limit alcohol, gradual weight loss
If C‑peptide is high (>3.0 ng/mL):
- Your pancreas is overworking
- Focus on: all 5 steps in this series to reduce insulin demand
If C‑peptide is low (\<1.0 ng/mL):
- See your doctor immediately—possible beta-cell failure
5. Retest every 3 to 6 months
Track your progress:
| Date | ALT | AST | GGT | Uric Acid | C‑Peptide |
|---|---|---|---|---|---|
| \_\_\_\_\_\_\_\_ | \_\_\_\_ | \_\_\_\_ | \_\_\_\_ | \_\_\_\_\_\_\_\_ | \_\_\_\_\_\_\_\_ |
| \_\_\_\_\_\_\_\_ | \_\_\_\_ | \_\_\_\_ | \_\_\_\_ | \_\_\_\_\_\_\_\_ | \_\_\_\_\_\_\_\_ |
| \_\_\_\_\_\_\_\_ | \_\_\_\_ | \_\_\_\_ | \_\_\_\_ | \_\_\_\_\_\_\_\_ | \_\_\_\_\_\_\_\_ |
(Note: Elevated liver enzymes can also result from alcohol use, hepatitis, or medications; discuss any abnormalities with your physician to rule out other causes.)
Over three to six months of targeted lifestyle intervention, expect ALT to decrease by 10 to 30 U/L if initially elevated, serum uric acid to drop by 0.5 to 1.5 mg/dL, and fasting C-peptide to normalize toward the 1.0 to 2.0 ng/mL range if previously elevated. These changes confirm multi-organ metabolic improvement beyond glucose control alone.
Final Insights
You now hold a comprehensive, evidence-based lab panel that transforms vague dietary effort into quantifiable metabolic change. Fasting insulin reveals hidden pancreatic overwork years before glucose rises. HOMA-IR integrates insulin and glucose into a single resistance score that tracks intervention response over time. The triglyceride-to-HDL ratio exposes lipid dysregulation and cardiovascular risk. Hemoglobin A1c captures chronic glucose exposure over months, and liver enzymes, uric acid, and C-peptide illuminate hepatic fat, purine metabolism, and beta-cell reserve. Together, these five steps deliver objective proof that your efforts are reversing insulin resistance at the cellular level.
These numbers are not just abstract markers. When your fasting insulin drops, your body produces less systemic inflammation. When your HOMA-IR falls below 2.0, your risk of progressing to Type 2 diabetes drops by more than half over five years. Normalizing your TG/HDL ratio decreases the burden of small, dense LDL particles and reduces arterial plaque formation. Bringing HbA1c into the optimal range (below 5.4 percent) protects against microvascular and macrovascular complications. Reducing liver enzymes and uric acid alleviates fatty liver disease and gout risk, while preserving C-peptide secretion maintains long-term beta-cell function. Each marker improvement cascades into broader health gains, from enhanced energy and mental clarity to reduced medication burden and improved longevity.
This lab panel integrates directly with the nutrition strategies in Article 2, the muscle-based glucose clearance tactics in Article 3, and the sleep, stress, and timing optimization in Article 5. Order your baseline panel before implementing any changes, repeat every three months during active reversal, and transition to every six to twelve months once you reach target ranges. Share your results with your healthcare team to guide medication adjustments, screen for comorbidities, and document measurable progress. If you take insulin or sulfonylureas, coordinate closely with your physician to prevent hypoglycemia as your insulin sensitivity improves and medication requirements change.
Reversing insulin resistance is not a matter of hope or guesswork. It is a trackable, verifiable process grounded in peer-reviewed science. With this five-marker panel, you will know within three months whether your current approach is working or whether you need to adjust your strategy. Start today by scheduling your baseline tests, and prepare to see the evidence of metabolic progress documented in black and white.
What to Do Next
You have three immediate options based on where you are in the process.
- Option 1: Schedule your baseline lab panel within the next two weeks. Request fasting insulin, fasting glucose, a lipid panel (for triglycerides and HDL), HbA1c, a Comprehensive Metabolic Panel with liver enzymes, serum uric acid, and fasting C-peptide (if you have prediabetes or a family history of diabetes). Bring your results to your next physician appointment and share the five-category framework from Article 1.
- Option 2: Review Articles 2 and 3 to implement the diet and exercise strategies that move these markers. Focus on low-glycemic foods, post-meal walking, and twice-weekly resistance training while you wait for your results. These are the highest-leverage interventions for reducing fasting insulin and HOMA-IR within the first three months.
- Option 3: Read Article 5 next: "The Hidden Variables Keeping Your Blood Sugar High." Sleep deprivation, chronic stress, and late meal timing all directly affect the lab markers tracked in this article. Understanding these hidden variables ensures that your dietary and exercise efforts are not being silently undermined before your next blood draw.